


Why Is a Standard Curve So Important in ELISA?
 source:ELK Biotechnology
 date:2026-06-23
 views:206
Why Is a Standard Curve So Important in ELISA?
Enzyme-linked immunosorbent assay (ELISA) is a quantitative immunoassay technique widely used in various research fields due to its high sensitivity, strong specificity, simple operation, high throughput, broad applicability, and good sample compatibility.
The standard curve serves as the core basis for converting absorbance (OD value) into the actual concentration of the target analyte. It runs through the entire experimental workflow, and its accuracy directly determines the validity of the final results. From an operational perspective, its importance is as follows:
I. Core Function: Enabling Quantitative Detection
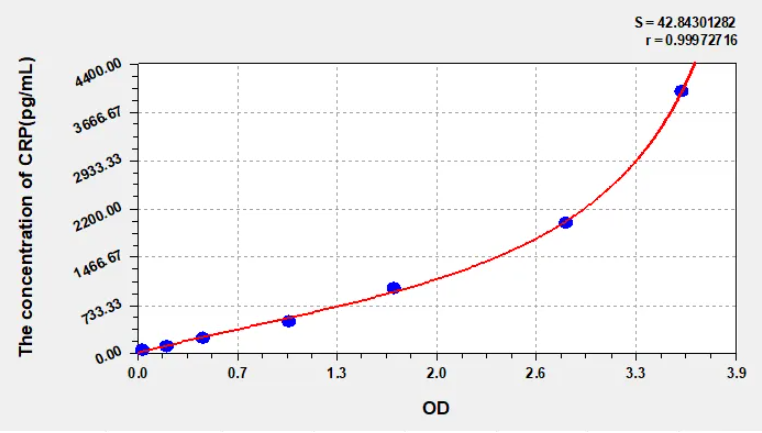
The ELISA reader can only measure the optical density (OD) of samples, which is an optical signal and cannot directly represent the true concentration of the target antigen/antibody. In the experiment, a series of standard solutions with known gradient concentrations are prepared and processed through the complete ELISA procedure (including sample addition, incubation, washing, color development, and stop solution) simultaneously with the test samples. A standard curve is then fitted with the standard concentration on the y-axis and the corresponding OD value on the x-axis. By substituting the OD value of a test sample into the curve equation, the actual concentration of the target analyte in the sample can be calculated. Without a standard curve, ELISA can only be used for qualitative (positive/negative) analysis, not for accurate quantification.
II. Calibrating the Experimental System and Offsetting Systematic Errors
ELISA involves many steps and complex influencing factors (e.g., pipetting errors, incubation temperature/time, washing intensity, color development time, reagent activity, etc.), which can introduce systematic bias across the entire system:
1.Standards and test samples react simultaneously on the same microplate, under the same environment, and with the same set of reagents—the curve reflects the reaction efficiency of the current experimental system in real time.
2.If reagent activity decreases or incubation is insufficient in a single experiment, the OD values of all standards will be uniformly lower, shifting the curve accordingly. This deviation is automatically corrected in the calculated results of test samples, significantly reducing systematic errors across the entire plate.
3.Each microplate must have its own standard curve; historical curves cannot be reused because the operation and environmental conditions of each plate are never identical, and an old curve cannot adapt to the current experimental system.
III. Assessing Experimental Validity and Controlling Quality
The shape, linearity, and R² (coefficient of determination) of the standard curve are the primary indicators for determining whether an ELISA experiment is acceptable—they are key quality control parameters in practice:
1.Verification of linear range: A valid standard curve should show a smooth dose-response relationship (indirect ELISA typically yields an S-shaped curve, while competitive quantitative ELISA often shows an inverse relationship). If the curve has abnormal inflection points or if high/low concentration points deviate from the trend, it indicates pipetting errors, standard degradation, or over/under color development—rendering the entire plate's data invalid.
2.Linear correlation coefficient R²: For quantitative ELISA, R² ≥ 0.99 is required. If R² does not meet this standard, the correlation between concentration and OD is poor, and the quantitative results are completely unreliable.
3.Determination of limit of detection/limit of quantification: The lowest concentration standard on the curve defines the minimum detectable concentration of the assay, helping to determine whether low-concentration samples fall within the effective detection range and avoiding false "negative" judgments.

IV. Defining the Detection Range and Avoiding Distorted Results
1.High-concentration samples: If the OD value of a test sample falls below the lowest point of the standard curve (for competitive ELISA) or above the highest point (for sandwich ELISA), the sample concentration exceeds the linear detection range. The signal enters a plateau, and the calculated concentration will be severely underestimated or distorted. In such cases, the sample must be diluted and retested.
2.Low-concentration samples: If the OD value is close to the baseline of the curve, it is necessary to combine the curve's limit of quantification to determine whether the result reflects a true low value or experimental background interference—distinguishing valid data from invalid noise.

V. Data Traceability and Result Reproducibility
1.The standard curve and original OD values are essential components of the raw ELISA experimental record, used for data traceability and troubleshooting experimental issues.
2.Standardized curve parameters (equation, R², concentration gradient) ensure consistent judgment criteria across the same batch and subsequent repeat experiments, guaranteeing reproducibility and comparability of results.

Important Notes for Standard Curve Sample Testing
1.Standards should be prepared fresh and used immediately. If reconstituted standards are not fully used, discard the remainder.
2.The standard curve typically includes 8 points (including the zero well), but at least 6 points are required. If individual wells show abnormal readings, they can be excluded.
3.For sandwich ELISA, the standard curve preparation and sample concentration calculation require subtracting the background value of the zero well; for competitive ELISA, this is not necessary.
4.The correlation coefficient of the standard curve may vary depending on experimental requirements, but generally, the correlation coefficient R should be at least 0.99. The closer R is to 1, the better the curve fit.
For detailed methods on fitting the standard curve, please refer to:
https://www.elkbiotech.cn/view/683.html

 RETURN