


Mouse Lp-a(Lipoprotein a) ELISA Kit
 One-click to copy product information
 Size: Size: |
 Price: Price: |
|---|---|
| 48 T | $320.00 |
| 96 T | $458.00 |
| 96 T*5 | $1947.00 |
 Manual
 Overview
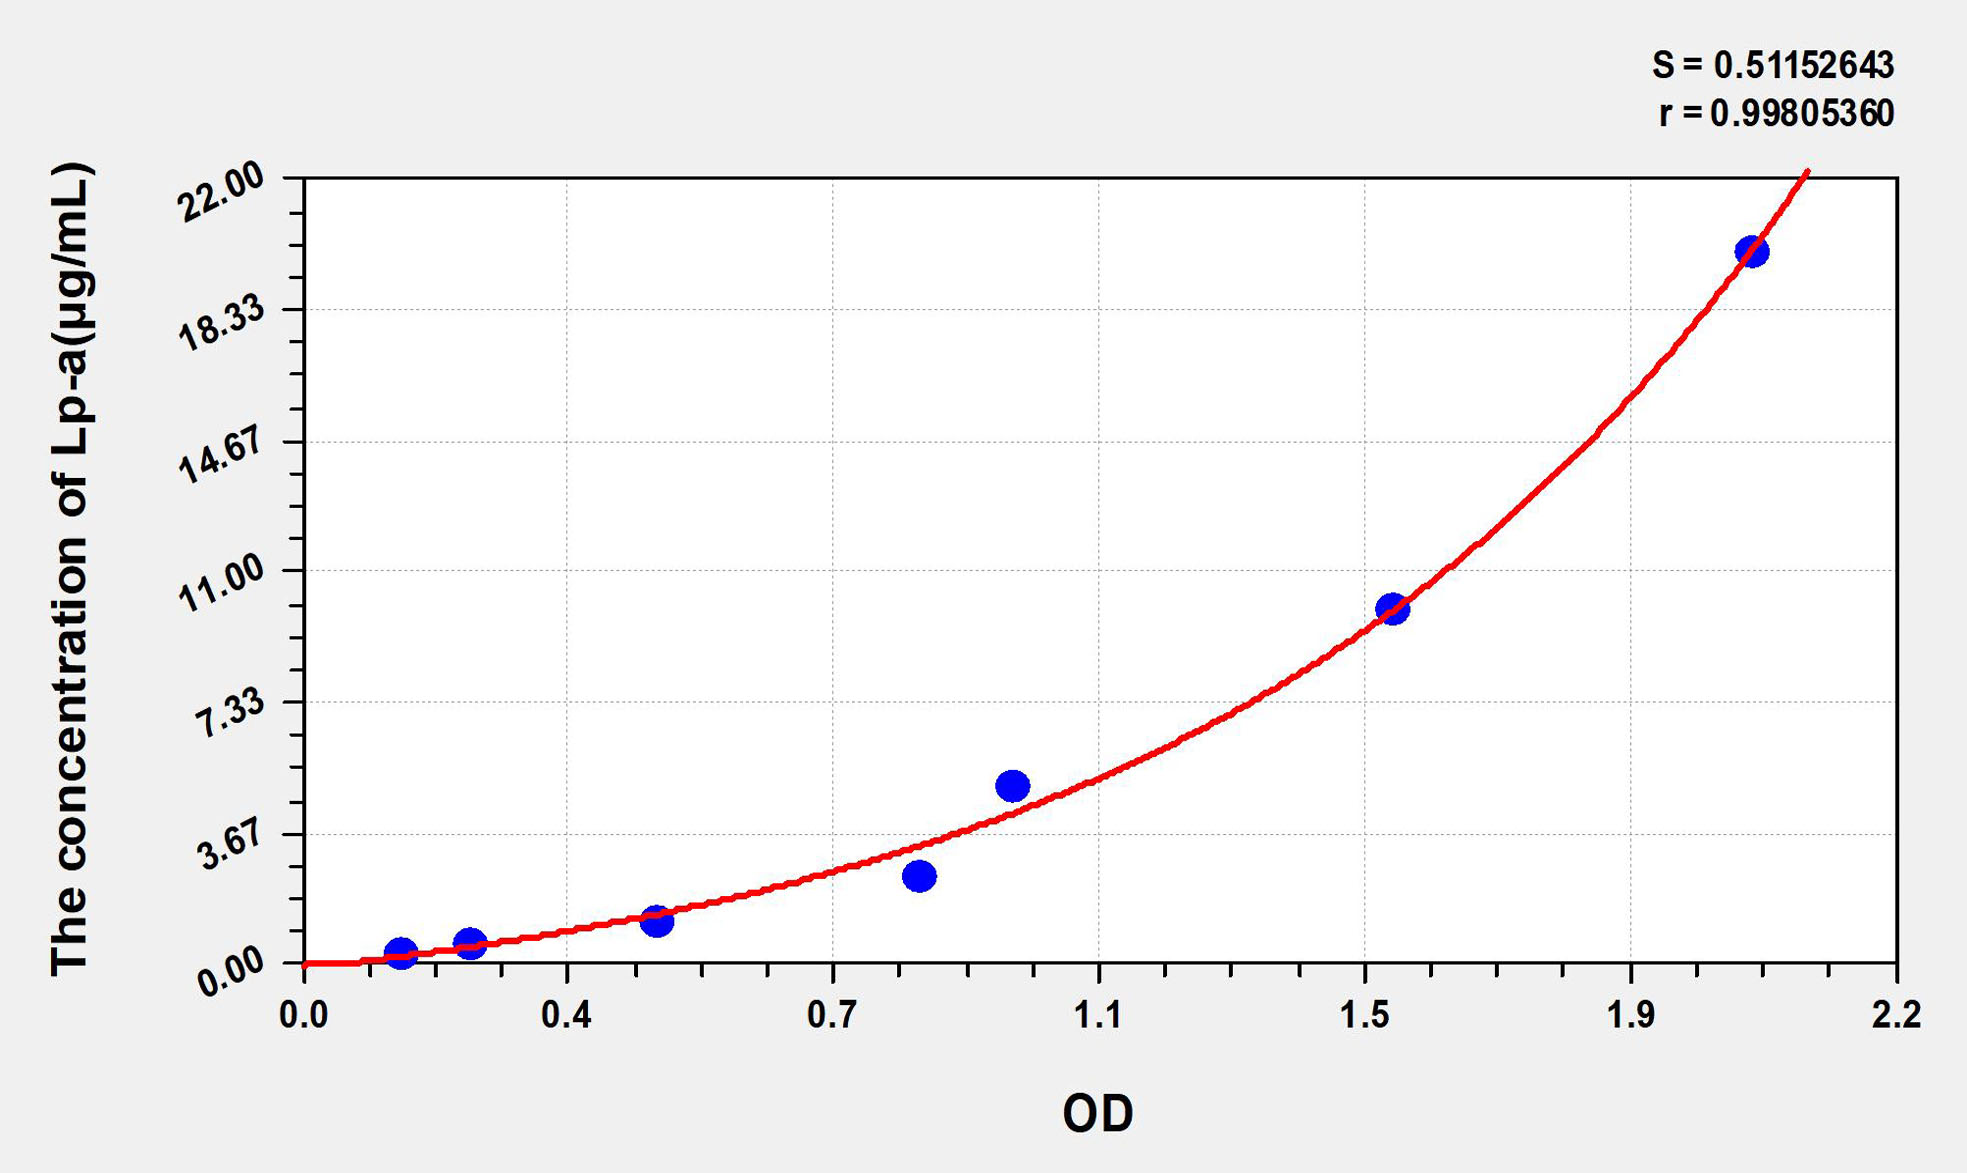
Standard curve
| Concentration (µg/mL) | OD | Corrected OD |
|---|---|---|
| 20.00 | 2.132 | 2.037 |
| 10.00 | 1.628 | 1.533 |
| 5.00 | 1.096 | 1.001 |
| 2.50 | 0.963 | 0.868 |
| 1.25 | 0.595 | 0.500 |
| 0.63 | 0.331 | 0.236 |
| 0.32 | 0.235 | 0.140 |
| 0.00 | 0.095 | 0.000 |
Precision
Intra-assay Precision (Precision within an assay):CV%<8%
Three samples of known concentration were tested twenty times on one plate to assess intra-assay precision.
Inter-assay Precision (Precision between assays):CV%<10%
Three samples of known concentration were tested in forty separate assays to assess inter-assay precision.
Recovery
Matrices listed below were spiked with certain level of recombinant Lp-a and the recovery rates were calculated by comparing the measured value to the expected amount of Lp-a in samples.
| Matrix | Recovery range | Average |
|---|---|---|
| serum(n=5) | 95-107% | 101% |
| EDTA plasma(n=5) | 87-99% | 93% |
| Heparin plasma(n=5) | 82-95% | 88% |
Linearity
The linearity of the kit was assayed by testing samples spiked with appropriate concentration of Lp-a and their serial dilutions. The results were demonstrated by the percentage of calculated concentration to the expected.
| Matrix | 1:2 | 1:4 | 1:8 | 1:16 |
|---|---|---|---|---|
| serum(n=5) | 97-105% | 88-95% | 96-102% | 83-97% |
| EDTA plasma(n=5) | 95-103% | 88-96% | 81-95% | 91-102% |
| Heparin plasma(n=5) | 89-97% | 86-102% | 94-106% | 85-97% |