


Why is it so important to make a standard curve
 source:ELK Biotechnology
 date:2023-08-02
 views:5056
Because of its easy operation,enzyme-linked immunosorbent assay (ELISA) can simply answer the basic question of how many proteins/polypeptides/antibodies are in the sample. It is a commonly used detection method in scientific research.The core of this simple analysis method is the standard curve.Without it,our experiment becomes a binary "yes/no" test.With it,we can delve into the details of biological responses. So, what makes standard curves so powerful? Let's discuss this in the context of ELISA.
Simply put, a standard is a series of positive controls with known amounts of the target protein.For example,if you run an ELISA test for human IgG,the standard curve will contain gradually decreasing known amounts of human IgG,which will allow you to draw a series of conclusions at once.
1.Does my ELISA assay work?
Can you see the signal from the standard? If you can, experimentation is good; if not, troubleshooting should be checked. Maybe an antibody issue, or something else in the system that wasn't optimized.
2.Is my ELISA test normal?
This is a trickier question. Does the signal decrease when the standard concentration decreases? If the answer is yes, that's a good start. If the answer is no, some background may have been introduced at some steps, or the pipette may need to be calibrated.
3.Has background been introduced into the system?
A set of appropriate standards always ends with a blank, in which no standard is present in the blank wells. If the OD value of the blank wells is >0.1, some background may be introduced.
| Serial | 1 | 2 | 3 | 4 | 5 | 6 | 7 | 8 | 9 | 10 | 11 | 12 |
| A | 0.001 | 0.0 | 0.0 | 3.196 | 3.528 | 0.001 | 0.001 | 0.0 | 0.0 | 0.0 | 0.0 | 0.0 |
| B | 0.0 | 0.0 | 0.0 | 1.948 | 1.948 | 0.0 | 0.0 | 0.0 | 0.0 | 0.0 | 0.0 | 0.0 |
| C | 0.0 | 0.0 | 0.0 | 0.924 | 0.975 | 0.0 | 0.0 | 0.0 | 0.0 | 0.0 | 0.0 | 0.0 |
| D | 0.0 | 0.0 | 0.0 | 0.502 | 0.517 | 0.0 | 0.0 | 0.0 | 0.0 | 0.0 | 0.0 | 0.0 |
| E | 0.0 | 0.0 | 0.0 | 0.36 | 0.328 | 0.0 | 0.0 | 0.0 | 0.0 | 0.0 | 0.0 | 0.0 |
| F | 0.0 | 0.0 | 0.0 | 0.277 | 0.265 | 0.0 | 0.0 | 0.0 | 0.0 | 0.0 | 0.0 | 0.0 |
| G | 0.0 | 0.0 | 0.0 | 0.258 | 0.241 | 0.0 | 0.0 | 0.0 | 0.0 | 0.0 | 0.0 | 0.0 |
| H | 0.0 | 0.0 | 0.0 | 0.237 | 0.213 | 0.0 | 0.0 | 0.0 | 0.0 | 0.0 | 0.0 | 0.0 |
This is the marker data of the "Human C-reactive protein (CRP) enzyme-linked immunosorbent assay kit (ELK1040)" that our colleagues in the marketing department did during the experimental training (the newcomer can't remember the last time he took a pipette how many years ago).


The so-called "standard curve" used for immunoassays is actually called a fitted curve. In immunodetection, if the concentration of the standard point (which may or may not be double-diluted) can show a linear relationship with the corresponding absorbance (OD) value, it is of course the most ideal curve, and then calculate the concentration value of the sample. However, when we do immunoassays, we rarely have such an ideal situation. The concentration of the standard substance and the corresponding OD value are often in an "S"-shaped curve relationship. At this time, we cannot use a straight line fitting method. It is necessary to make a choice.
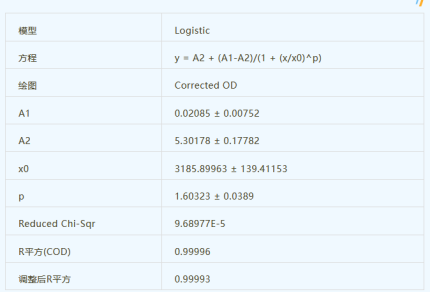
Regarding the fitting method of the standard curve, although the straight line, quadratic curve, cubic curve, exponential, logarithm, etc. can be used for curve fitting in ELISA and other biological reactions, they are only suitable for a part of the curve, and some are suitable for For the first half, some are suitable for the second half, and some are suitable for the middle section, and the Logistic curve has good applicability to all the curves. Of course, if it is used for quantification, it is better to be in the middle section. Although none of these methods are universal, they can all be used. The key is which part of the sigmoid your standard curve does, and which part of the curve you want to detect for the sample concentration. In the low concentration part of the S curve, the power equation can be used to fit well, the middle and low concentration part can use the linear equation, the middle part can use the logarithmic equation, and the middle and back parts can be used with four parameters.
At present, the commonly used immunodetection fitting method in the world is "four-parameter logistic fitting". This fitting method can often reflect the curve relationship between concentration and absorbance, so as to further accurately obtain the concentration of the substance to be tested in the sample. concentration. In fact, in a long interval, Logistic should be able to fit more ideally. But that's not to say it is. In fact, not only ELISA, but many other biological reactions are sigmoid curves, which can also be fitted by logistic curves. But building a model is one thing, and using it to quantify is another. If it is used for quantification, the middle section (the steeper part) of the S-shaped curve is better, while the calculation error of the flat part at both ends will be large, sometimes even large.
There are several problems that need to be paid attention to when doing the standard curve sample detection
1. The indicators such as the concentration of the sample are calculated according to the standard curve, so first of all, the standard curve should be regarded as a more important thing than the formal experiment, otherwise the subsequent experimental results will not be discussed.
2. Set the standard concentration range of the standard curve sample to have a relatively large span, and to cover the concentration of the experimental sample you want to detect, that is, the concentration of the sample should be within the standard curve concentration range, including the upper and lower limits. For the S-shaped standard curve, try to make the concentration of the experimental sample in the steepest part of the middle slope, that is, the curve is almost straight.
3. It is best to use the double dilution method to prepare the standard sample concentration in the standard curve, so as to ensure that the concentration of the standard sample will not deviate greatly.
4. When testing the standard sample, it should be carried out in the order of increasing concentration to reduce the influence of high concentration on low concentration and improve the accuracy.
5. The number of samples for the standard curve is generally 7 points (excluding blank well and background well), but at least 5 points should be guaranteed).
6. The correlation coefficient of the standard curve made varies due to different experimental requirements, but in general, the correlation coefficient R should be at least greater than 0.90 (at least one nine), and for some experiments, at least 0.99 or even 0.999.

 RETURN